Topdressing? You need rootzone analysis.
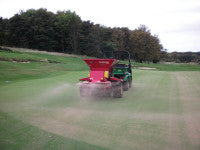 Compatibility is a critical factor when selecting a topdressing, the topdressing must be compatible with the rootzone it is being applied to, therefore any decision regarding the selection of a topdressing must first consider the rootzone.
The quality and playability of a sports surface is dependent on the rootzone underfoot, this can be the indigenous topsoil or an imported growing medium; whether playability is good, bad or indifferent the performance is directly influenced by the physical properties of the rootzone. Informed management decisions regarding sports surface playability and the selection of a suitable topdressing cannot be made until the physical properties (often described as the mechanical properties) of a rootzone are known; the only accurate way of determining the physical properties of a rootzone is through laboratory testing. No meaningful management decisions can be made if the physical characteristics of a rootzone has not been tested.
Knowing the texture of rootzone underfoot is probably the single most important piece of information a professional turfgrass manager can have.
It is essential that the physical properties of a working rootzone are tested and understood, knowing the texture of the rootzone underfoot is probably the single most important piece of information a turfgrass manager can have. Rootzone texture is defined by the proportion and distribution of sand, silt and clay size particles in the rootzone framework; laboratory analysis of a rootzone sample will use particle size distribution and sedimentation testing to determine these proportions.
 The results of a rootzones texture analysis will identify the distribution and percentage of sand, silt and clay size particles across a range of textural classes. Table 1 shows the particle size categories most commonly used in the analysis of rootzones, topdressings and sports sands, the size ranges are given in both millimetres and microns.
Table 1 clearly presents the size range within each category, however, it is not very good at showing the significant size differences between categories, for example, a grain of very coarse sand with a spherical diameter of 2.0mm is two thousand times bigger than a clay size particle measuring 0.001mm or 1 micron.
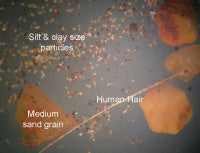 Plate 1 uses microscopic analysis to illustrates the variation in size between a medium sand grain (0.5 - 0.25mm) compared with silt and clay size particles (< 0.05mm) compared with a human hair (approx 0.05mm).
To determine the sand fraction a pre-prepared, oven-dried, rootzone sample is weighed and mechanically shaken through a nest of sieves, the aperture of the mesh in each sieve getting progressively smaller.
Plate 2 illustrates a nest of sieves and a single sieve showing the mesh aperture. The amount of material retained in each sieve is weighed and reported as a percentage of the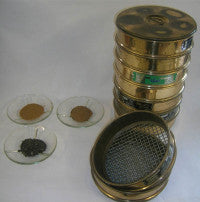 whole sample.
The material retained in the bottom sieve (the pan) passes through a mesh with an aperture of 50 microns, this is the combined silt and clay fraction. The individual silt and clay fractions are then calculated using a sedimentation test, the silt and clay fraction is added to a column of water which is then stirred; knowing that silt size particles fall through the suspension quicker than clay size particles, allows the measurement of bulk density within the suspension, and the corresponding calculation of the individual silt and clay fractions.
Once the rootzone analysis has been carried out, the results can be presented in a table; as an example, the particle size distribution values for a golf putting green rootzone have been added to Table 2. The amount of material retained in each sieve has been calculated as a percentage of the total.
 Looking more closely at the results, it can be seen that there is no material greater than 2.0mm in size, that the rootzone is dominated by the medium sand fraction 0.5-0.25mm, with a value of 57.22%, and there is very little material (less than 10%) in the combined very fine sand, slit and clay fractions.
The results of analysis should always be presented in a data table, but it is also useful to present the results in an alternative format, using a bar chart to complement the data table is good practice; whilst some readers maybe happy to digest information from a table of figures, for others, the visual presentation of a graph is easier to absorb.
Figure 1 has used the same example data recorded in table 2, to present the data in a bar-chart. The bar-chart clearly shows the dominant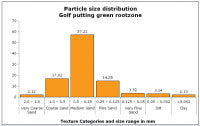 medium sand fraction and the tailing-off or reduction in finer particles. Often, gridlines are added to the chart to allow the reader to scan across to the y axis and estimate the value of each bar, however by adding data values above each bar, the reader no longer needs to scan the chart, and the grid lines can be removed to create a cleaner presentation.
Every playing surface has its own unique environment, geographic location, elevation above sea level, physiographic position of site, i.e. plateau, hill slope, terrace valley floor, depression etc. The topography of the surrounding countryside, flat, undulating, hilly, rolling etc. The microtopography which describes small features such as mounds, water courses, surrounding vegetation, shade etc. The depth of the rootzone and the permeability of the soil horizon below will also have an effect on playability.
Of all the variables under consideration, the rootzone texture is the finger print of the playing surface. The rootzone texture will influence (amongst other things) drainage, water retention, root development, soil oxygen and the propensity of a rootzone to compact over time. It will determine the porosity, the spaces between the particles which contain air and water, it will also influence fertility, microbial activity.
In general, and remembering location, topography etc., sandy rootzones will tend to be free draining, leaching will remove nutrient and fertilser. Mostly, they will be less fertile with a low capacity for water retention, making them more prone to drought in prolonged period of dry weather, they will be firmer underfoot and may have higher soil oxygen values which will aid microbial activity and the decomposition of thatch. Heavier rootzones - those with very fine sand, silt and clay fractions - are often more fertile, but may suffer from impeded drainage; they will be softer underfoot and may become unplayable in prolonged periods of wet weather.
Professional turfgrass managers will have an intimate knowledge of the way their sports surface performs, for example, before applying fertiliser, they will know (through analysis) the nutrient status and will adjust the application as appropriate. The same is true for topdressing; by knowing the physical structure of a rootzone the correct topdressing can be selected.
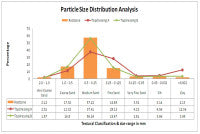
Topdressing manufacturers will have up-to-date analysis sheets of the topdressings they supply, by comparing the rootzone and topdressing analysis a compatible topdressing can be selected. Figure 2 compares the rootzone data used in the earlier example, with the particle size distribution of topdressing A and topdressing B.
Looking at the data in figure 2, topdressing B (the green line) has a high degree of compatibility with the rootzone, topdressing A (the red line) is not a good match and would be rejected.
Particle size distribution analysis is fundamental to successful sports surface management, but it is not the total picture, pH and organic matter content should also be considered as primary tests on existing rootzones; air and water filled porosity, bulk density and hydraulic conductivity can also be investigated and should be included in rootzone specifications for new build.
Most topdressing manufacturers will be able to supply you with an up-to-date analysis of the topdressing they supply, they may also offer rootzone analysis as part of their service. Topdressing? You need rootzone analysis.
About the author:
John Farrell B.Sc M.Sc. Studied for his B.Sc at the University of East Anglia. In 2006 he gained a Masters Degree in Sports Surface Technology from Cranfield University. He is the current Chairman of the British Rootzone and Topdressing Manufacturers Association (BRTMA), Technical Director of a UKAS accredited soil testing laboratory, and a director with Baileys of Norfolk Ltd., who he has worked with in the turfgrass industry for more than twenty years.
