Setting the standard for Council managed winter sport fields
Best Use Modelling for Sport Surfaces Project - Setting the standard for Council managed winter sport fields
The measurement of the performance characteristics of a sports field provides knowledge of the current condition of the sports field, and enables comparisons to be made to prescribed standards. If certain performance characteristics, such as surface hardness or drainage, are identified as being below the prescribed standards, informed decision making, as to the adjustments the management practices require to achieve the prescribed standards, can be made.
An empirical set of prescribed standards for council managed sports fields has been proposed by the New Zealand Sports Turf Institute (NZSTI). These standards are based upon observations and measurements made by senior Agronomists over many years across a broad range of sports fields. An example of the proposed standard is given in the following table.
Proposed Performance standard - for Council managed sports fields
|
Component |
Limits |
Notes |
|
Total ground cover |
> 98% at start of a winter/summer playing season; >80% during a playing season No bare areas greater than 100 mm in diameter |
Visual assessment using a quadrate (0.5 x 0.5m or greater) divided into 100 squares |
|
Weed cover |
< 20% grass weeds no broad leaf weeds |
Visual assessment using a quadrate (0.5 x 0.5m or greater) divided into 100 squares |
|
Evenness |
< 20mm |
Measured below 3m straight edge |
|
Surface slope - Direction of play - Across play |
1.25% 2.5% |
Measured using 3m straight edge and Smart digital level or similar |
|
Surface Hardness |
35 - 150g |
2.25kg Clegg Hammer |
|
Worm activity |
< 6 surface casts per m2 |
Count number of surface cast in a quadrate (0.5x0.5m or greater) divided into 100 squares |
|
Soil drainage |
No visual symptoms of poor drainage in top 50mm*, no surface water remains 1 hour after rainfall ceases |
Assessed from 50mm soil core taken to 100mm, visual assessment of surface |
* Visual symptoms include red/orange or grey mottling, heavy clay layers near surface, continuous layers of blue/black, anaerobic odour
Monitoring the progress of the desired changes to the performance characteristics through a process of reviewing and re-measurement will show whether or not:
· Any adjustments to the management practices were effective.
· Any further adjustments to the maintenance practices are required.
· The sports field has achieved the prescribed standard.
The Best Use Modelling for Sports Surfaces Project, developed by the NZSTI, incorporates a programme of periodic measurement and assessment of the performance characteristics of a sports field, and suggests the direction that future management decisions and practises should take to achieve or maintain specified performance characteristics through:
· Benchmarking existing performance characteristics.
· Identifying any management practises that may be limiting field performance.
· Identifying changes to maintenance practices that are required to improve field performance.
· Producing a calendar of specific maintenance work, such as aeration treatments.
· Providing advice on best practise.
In some instances, dependant on the aspirations of the sports field manager, the recommendation of upgrading existing infrastructure, such as installing drainage or irrigation, may be required, even to the point where a complete reconstruction of the surface is necessary.
Measuring performance characteristics
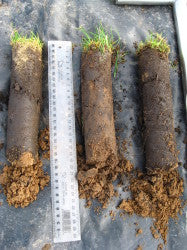
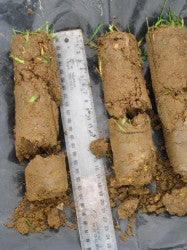
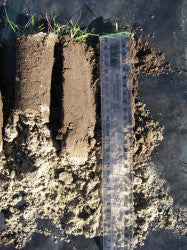
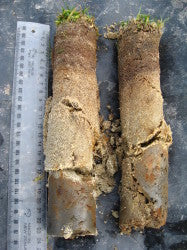
Two distinct areas of a sports field are measured; the soil profile properties, and the field's surface quality and performance. The evaluation of the soil profile is carried out to a depth of up to 300 mm (if possible). The properties that are measured and recorded include: depth of thatch, visible rooting depth, depth of soil layers, a determination of the soil texture and basic structure, and the presence of any mottling and anaerobic odours (Figure 1). Soil samples from 0-50 and 50-100 mm are collected for determination of volumetric water content, bulk density and percent organic matter. For sand carpet fields, the degree of contamination of the top 40 mm of sand by fine soil and organic material is also determined.
|
|
|
|
Figure 1: Example soil profile cores showing some of the variation in the profiles of the sports fields tested.
The field's surface quality and performance is measured by assessing the following:
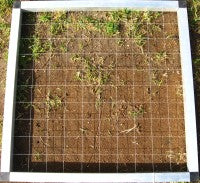
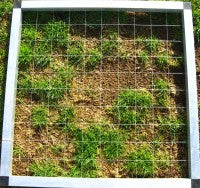
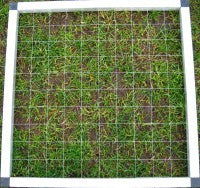
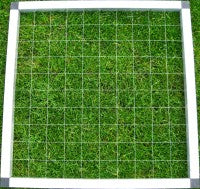
· Total percentage ground cover (including weeds) (Figure 2).
· Turf species composition.
· Percentage weed cover.
· Identification of weed species present.
· Surface hardness.
· Soil penetration resistance.
· Soil shear resistance.
· Surface evenness under a three metre straight edge.
· Surface slope in the direction of play and across the field of play.
· Evaluation of earth worm activity.
|
|
|
|
Figure 2: Some examples of total ground cover assessments - (from left to right) 10%, 30%, 60% and 100% cover.
Furthermore, the testing can be extended to incorporate infiltration rate and traction testing, as well as a full survey of field levels and an environmental compliance audit (ECA). With the option of having additional tests carried out, the Best Use Modelling Project service can be tailored to the specific needs of the council.
Ideally year-round testing is conducted to show any seasonal variation, particularly in ground cover and surface hardness. Where testing is limited, however, due to a full fixture list, budgetary constraints or other limiting factor, initial tests are carried out in the winter months when, in general, field performance is at its worst. Issues of poor ground cover, restricted drainage, and worm activity are clearly evident during the winter sports season.
Test locations
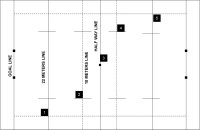
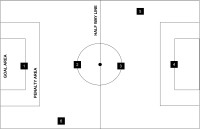
The locations of the tests correspond with those published previously, giving consistency in the sampling, and therefore achieving more reliable, repeatable long term testing. Testing positions for rugby (union and league) fields include four of the five locations described by McClement and Baker (1994), in an angled transect across the field (Figure 3). One wing location (fifth location of McClement and Baker) is substituted for an area which is most likely to become limiting, such as an area of poor grass cover or high concentration of weeds. Testing positions for football (soccer) fields include the six locations used by Holmes and Bell (1986) and Bell and Holmes (1988) representing areas of high, medium and low wear However, if another area of the field - an area of poor grass cover, high weed concentration or an existing large bare area - is likely to become limiting, this location would be substituted for one of the low wear areas. Each testing position covers an area of approximately 5 x 5 m, and within each test area three replicates of each performance test are undertaken.
|
|
Figure 3: Sampling locations for a Rugby and Football (soccer) pitch
The results of the initial tests provide the council with a performance benchmark for the sports field. Where test results fall below a desired performance standard, an appraisal of the soil profile analysis, performance testing results and management practices is carried out to identify what are the limiting factors to achieving the desired level of performance. Once the limitations have been identified, options for improving the benchmarked performance values are reported back to the council. Options for improving benchmarked performance may include changes to management practices through to a full upgrade on the field surface.
Eight pilot city councils throughout NZ have had the performance characteristics at some of their sports fields assessed under the Best Use Modelling Project (a total of 56 fields). This data has been used to develop the performance standards introduced earlier in this article. The recorded measurements have also been collated and inputted into a database specific to Best Use Modelling Project.
The Database
The Best Use Modelling Project database is a secure online relational database for the storage of council information, sports park information including management inputs and monthly usage, soil testing information, performance characteristics information, and climate data. Councils are able to input, edit and access their own data and view reports comparing their fields to, for example, the national average. The database also provides the ability to import data, such as data from the National Institute of Water and Atmospheric Research (NIWA). The information produced can be exported to desktop applications like Excel or Access, and photos can also be stored and linked to a given sports field.
The storage of performance characteristic data for a given field enables comparisons with historic data (generated over time) for that field, to show trends over time, and whether or not the expected performance characteristics are being achieved. The database also enables the user to generate reports specific to a given sports field, city council, region or national level.
The availability of information to councils increases as each participating council has the performance characteristics of their sports fields re-evaluated through additional testing (Figure 4). The process of re-testing provides a larger and more robust dataset for any comparative studies that a council would like to carry out.
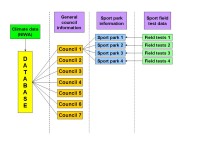
Figure 4: The generation of data into the Best Use Modelling for Sport Surfaces Project database
The Service
The Best Use Modelling for Sport Surfaces Project has generated a new service available to councils offered by the New Zealand Sports Turf Institute. The Sports Surface Management Evaluation System (SSMES) can be tailored to clearly identified council needs, which may range from poor surface performance, to over use of the facility and/or rationalisation of their sports field delivery. NZSTI can incorporate SSMES into the maintenance programme for a given sports fields, to give a reliable independent assessment of the grounds performance characteristics. SSMES comprises an analysis of the testing and evaluation described earlier, in conjunction with council and field information, to be able to produce reports with recommendations specific to the facility to achieve the aims of the council. Coupled with a regular review and monitoring process, SSMES is a tool to assist in the decision making process, and will help councils achieve a high quality, sustainable, long-term future for their sports fields. SSMES can also be used in tandem with other models, such as Auckland City Councils 'Sports Field Model' (SMF). The SFM can be used to determine where there are current surpluses and shortfalls in sports field provision, also to estimate the future demand for sports fields based on predicted changes in populations. Using the SFM will assist councils to determine if any required upgrading of a surface, identified through SSMES, is appropriate to meet future demand.
Authors:-
|
Dr Colin Mumford
Techncial Officer NZ Sports Turf Institute Palmerston North |

|
|
Dr Andrew Mitchell
Research & Benchmarking Co-ordinator NZ Sports Turf Institute Palmerston North |

|
|
Keith McAuliffe CEO NZ Sports Turf Institute |

|
For more information about SSMES, please contact Baz Woodcock on
Telephone 06 356 8090 ext 707
Fax 06 354 0081
Mobile 027 500 1333
E-mail bwoodcock@nzsti.org.nz
NZ Sport Turf Institute would like to thank SPARC and Technology NZ for their assistance with funding the Best Use Modelling for Sport Surfaces Project, and also the eight pilot councils for allowing access to their sports fields and for the information they contributed.
References
Bell, M.J. and Holmes, G. (1988). 'The playing quality of association football pitches', Journal of the Sports Turf Research Institute, 64, 19-47.
Holmes, G. and Bell, M.J. (1986). 'A pilot study of the playing quality of football pitches', Journal of the Sports Turf Research Institute, 62, 74-90.
McClements, I. and Baker, S.W. (1994). 'The playing quality of rugby pitches', Journal of the Sports Turf Research Institute, 70, 29-43.
Article kindly supplied curtesey of the New Zealand Turf Sports Turf Insitute (Inc) Published in their New Zealand Turf Management Journal (November 2008 Vol 23, no.4 issue).
